fbpx
Skip to main content
New Financial Assistance Hub

Insights

Infographics, graphs, visualisations

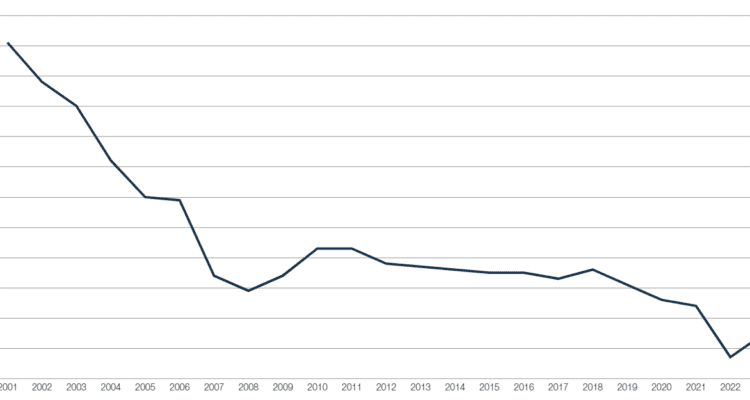
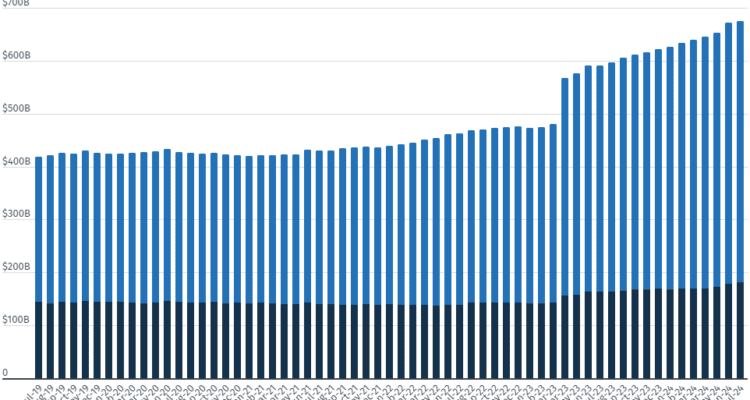
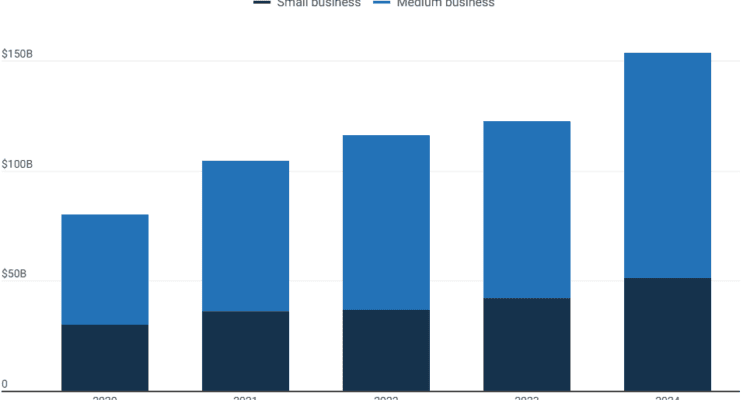
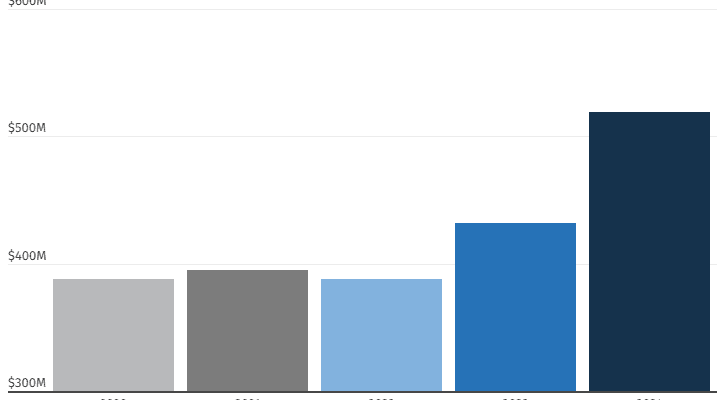
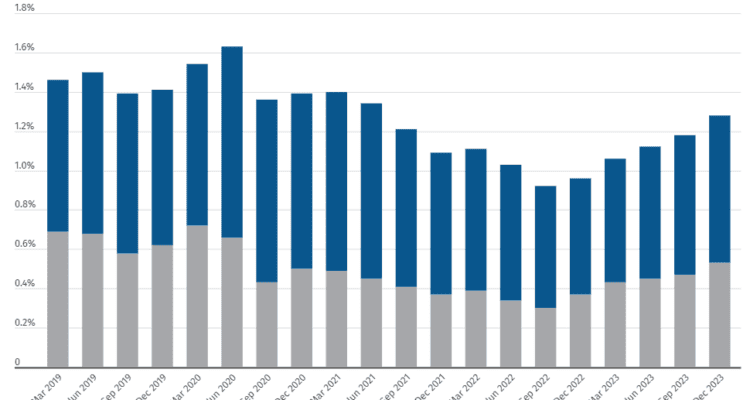
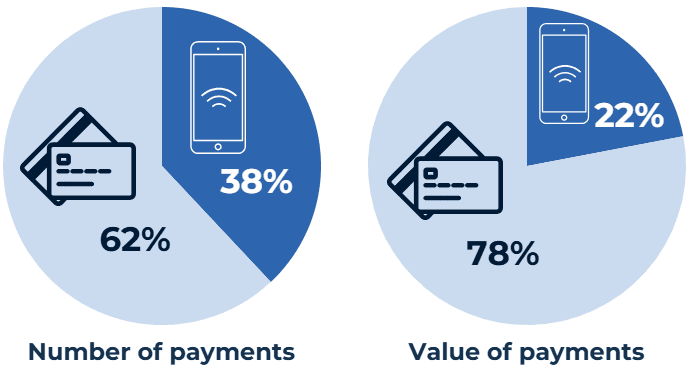
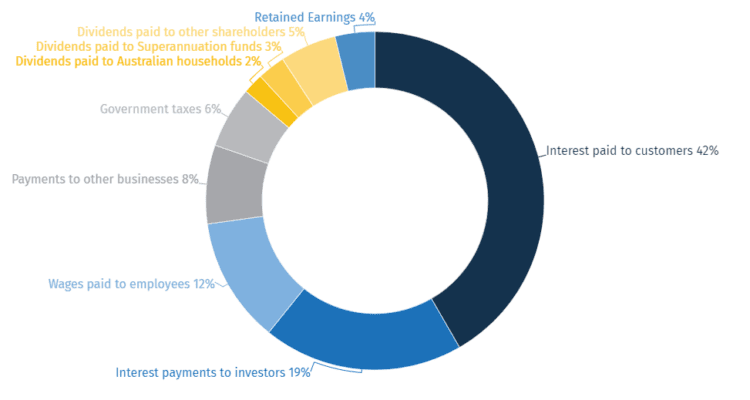
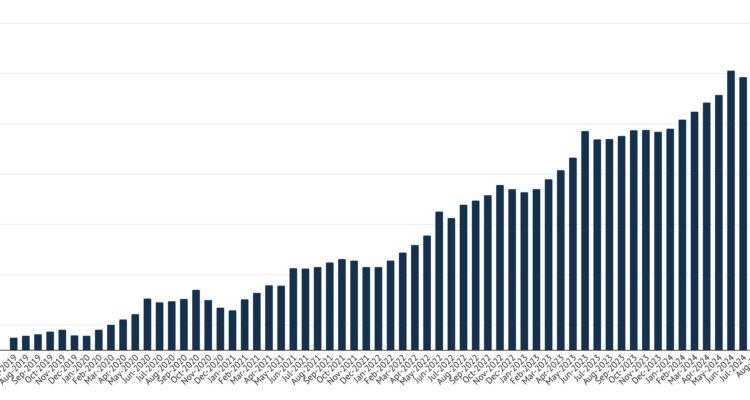
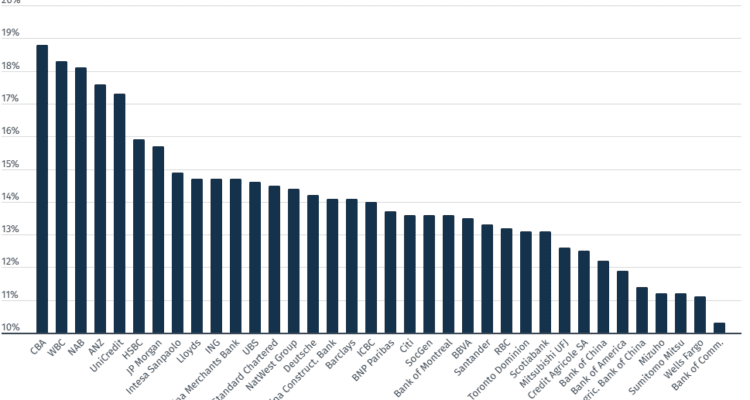
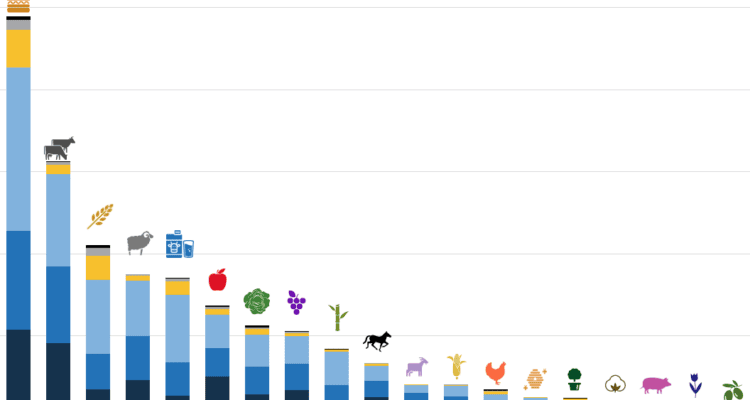
The ABA has produced a wide spectrum of Australian banking and banking-related infographics, from the impact of COVID-19 on lending, the rise and fall of loan deferrals, to scams data, transactions, changes in payment types, agribusiness lending to the drop in Net Interest Margins (NIM)s over the past two decades.

Household savings ratio

The latest national accounts show the household savings ratio at 3.2% in the December quarter

View Infographic

Agribusiness: 2023

174,471 Australian Agribusinesses have been lent $117 billion

View Infographic

Households: 2023

Australian households hold $2.2 trillion in mortgages and $1.4 trillion in deposits

View Infographic
Banking Data

Tax: 2022

Australian banks paid $10.7 billion in corporate tax in FY22

View Infographic
Agribusiness

Lending to agribusiness

Bank lending to agribusiness has risen to a record $104.7b as at September 2022.

View Infographic
Banking Data

Construction lending in Australia

•In July 2022, banks had around $22b in outstanding loans to the construction industry.
•This breaks down to roughly $13b for resident

View Infographic
Scams

Scams: A snapshot

Mobile Apps averaged $18k per scam. 12% of reported scams resulted in financial losses for a total of $336 million lost.

View Infographic
Banking Data

Banking by numbers: 2023

There are 95 banks in Australia and
200,091 bank employees serving 22.9 million customers.

View Infographic
Banking Data, SME

Lending to Australian SMEs

In April 2022 alone, over $13 billion in new loans were provided to micro, small and medium businesses.

View Infographic
Agribusiness

Top 20 agri, by turnover

Australian agriculture sectors, ranked by turnover, June 2021.

View Infographic